We are right in the middle of our unit on data management. While we will be conducting our own surveys and creating graphs to show the results, another important part of the unit is to interpret the graphs we see. For this week's challenge, take a look at this graph of OHL 2014-2015 team attendance. After reading the graph, tell three facts that you can tell from looking at the graph.
|
The most common strategy used for last week's challenge was to draw a picture, although one of our students was able to show how he was able to solve it using lego tables and people! Good work AM!! Last week we had a discussion about proportional reasoning. I needed to buy some cups for our "Minute to Win It" challenge and had to decide what was the best deal. Here is the chart we created. 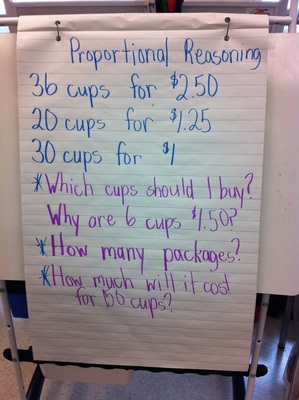  Here is another problem related to Proportional Reasoning
What is the best deal for TimBits if I need to buy 100 TimBits for a school event? |
Archives
November 2014
Categories |
 RSS Feed
